





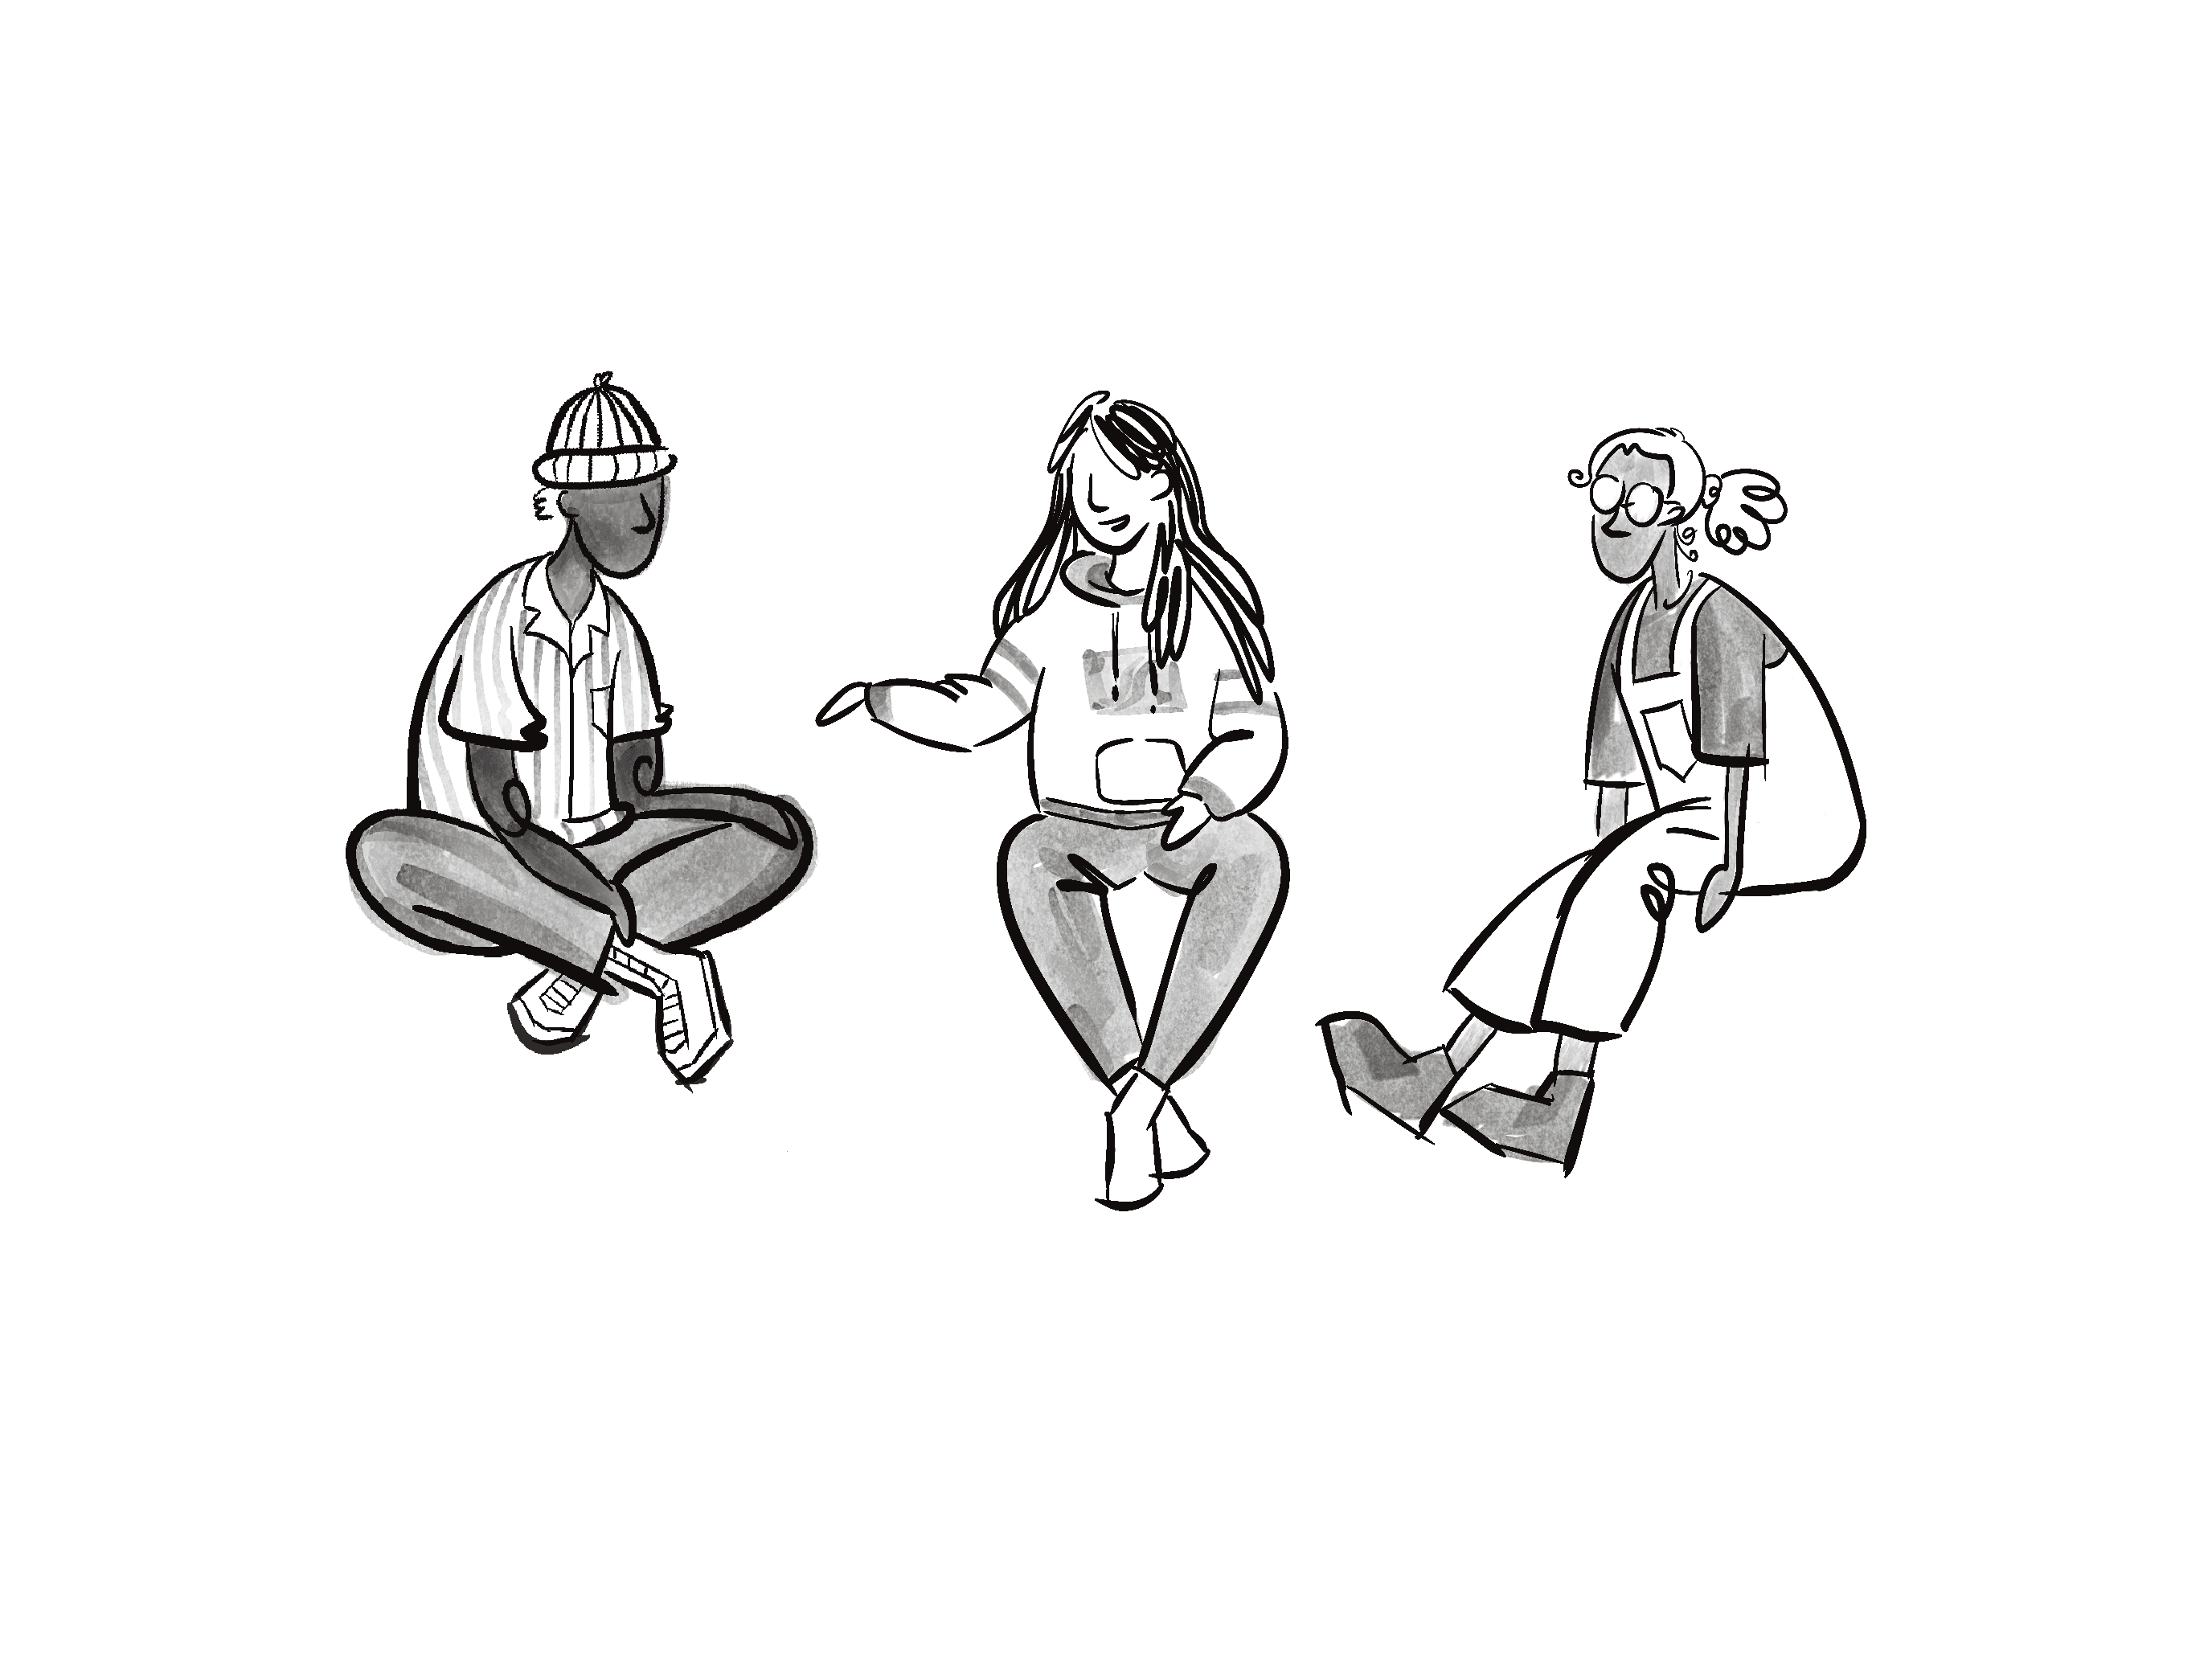



Three friends, all 17, are talking about their futures.
Scroll to listen inThe teenager on the left looks at his friends and says, “Ok, ok, but seriously, what’ll you do after this?”
“Design. Obviously. I've basically already started. You?” replies the girl in the middle.
“Thinking about nursing, maybe. Or something like it,” he responds.
The middle girl turns the other way and asks, “And you? You’ve gone quiet.”
“Definitely doing an apprenticeship. Get qualified and get paid, best of both,” says the other girl.
The girl in the middle smiles. “That’s actually decent.”
Who are NEET young people?
 As teenagers, we all imagine what our lives might turn out to be. But over the next year or so, these young people will have to turn their ambitions into real, actionable steps—whether that means getting a job or continuing their education.
However, over the last few years, more and more young people have struggled with the transition into the world of work.
These young people are often referred to as NEET—short for “Not in Education, Employment, or Training.”
The national NEET trend






In the United Kingdom, the NEET rate — the percentage of 18-24 year-olds who are NEET — fell through the 2010s. But by the start of 2026, it had climbed to 15.8%, its highest level since 2014.
The visual on the TV updates to show a line chart of the United Kingdom’s NEET rate from 2014 to 2026, with data from the Office for National Statistics.
When young people become NEET, it can have a long-term impact on things like their mental health, how much money they earn, and even their likelihood of experiencing the criminal justice system.
The visual on the TV shows a diagram listing the long-term impacts.
But right now, they're just trying to relax.
The visual on the TV fades out to nothing.
How risk factors compound





It’s one year later. Now these friends are 18 years old. One is in education, one is working. The other is doing neither; they are NEET. For a long time we’ve tried to understand what characteristics are associated with a higher risk of being NEET.
Visual shows the three teenagers standing in a row under the clock. The one on the right is NEET. A speech bubble pops up above their head that says, “What’d you call me?”
For example, growing up in a socioeconomically disadvantaged household (i.e. those who qualified for free school meals in Year 11) is associated with a higher likelihood of being NEET.
Visual shows the clock disappearing. The labels above each teenager are replaced by a semi-circle gauge indicating their likelihood of being NEET. Two of the teenagers didn’t grow up in disadvantaged households and have a NEET likelihood of 13%. The third teenager did, and has a likelihood of 24%.
We analysed these factors using a government dataset (Longitudinal Education Outcomes or “LEO”) that has tracked the trajectories of about four million young people aged 18 to 24. We found that certain characteristics, like having a disability, are associated with higher NEET rates.
Visual takes into account characteristics like having a disability. The first teenager’s not disadvantaged and doesn’t have a disability, and has a NEET likelihood of 10%. The second teenager is not disadvantaged, but does have a disability, and a NEET likelihood of 23%. The third teenager is both disadvantaged and has a disability, with a NEET likelihood of 34%.
When we combined characteristics in our analysis, we saw that some combinations are associated with far higher NEET rates than any single characteristic. For example, if we add the ethnic background of a young person to this analysis, we get a more granular picture.
Visual takes into account ethnicity along with the other characteristics. The first teenager is black and has a NEET likelihood of 10%. The second is Asian and has a likelihood of 20%. The third is white and has a likelihood of 37%.
And if we add qualification levels, we see NEET rates diverge even further.
Visual adds qualification levels. Higher qualification levels reduce NEET likelihood. The first teenager is at 7%; the second at 14%; and the third, with low qualification, is at 40%.
NEET rates across England
Less affluent regions tend to have significantly higher NEET rates than those with higher average socioeconomic status. Before we keep going, do you want to focus on all of England, or a specific area?

…or keep scrolling








































































These young people on the screen represent all 18 to 24 year olds in England, as of 2019.
We can divide them into whether they are from a disadvantaged background, as measured by whether they qualified for free school meals. In England, young people from disadvantaged backgrounds have a higher NEET rate than non-disadvantaged young people.
Now if we split up this group by their gender, we can see how these combined factors are associated with NEET rates in England. In England, young men from disadvantaged backgrounds have the highest NEET rate of these groups.
And we can see the further compounding effects of these characteristics when we divide the young people into their qualification levels. In England, young women from disadvantaged backgrounds with low qualifications have the highest NEET rate of these groups.
Instead of looking at the gender divide, we can look at whether a young person has special educational needs or disabilities. In England, young people from disadvantaged backgrounds with a disability have the highest NEET rate of these groups.
The long-term impact of being NEET






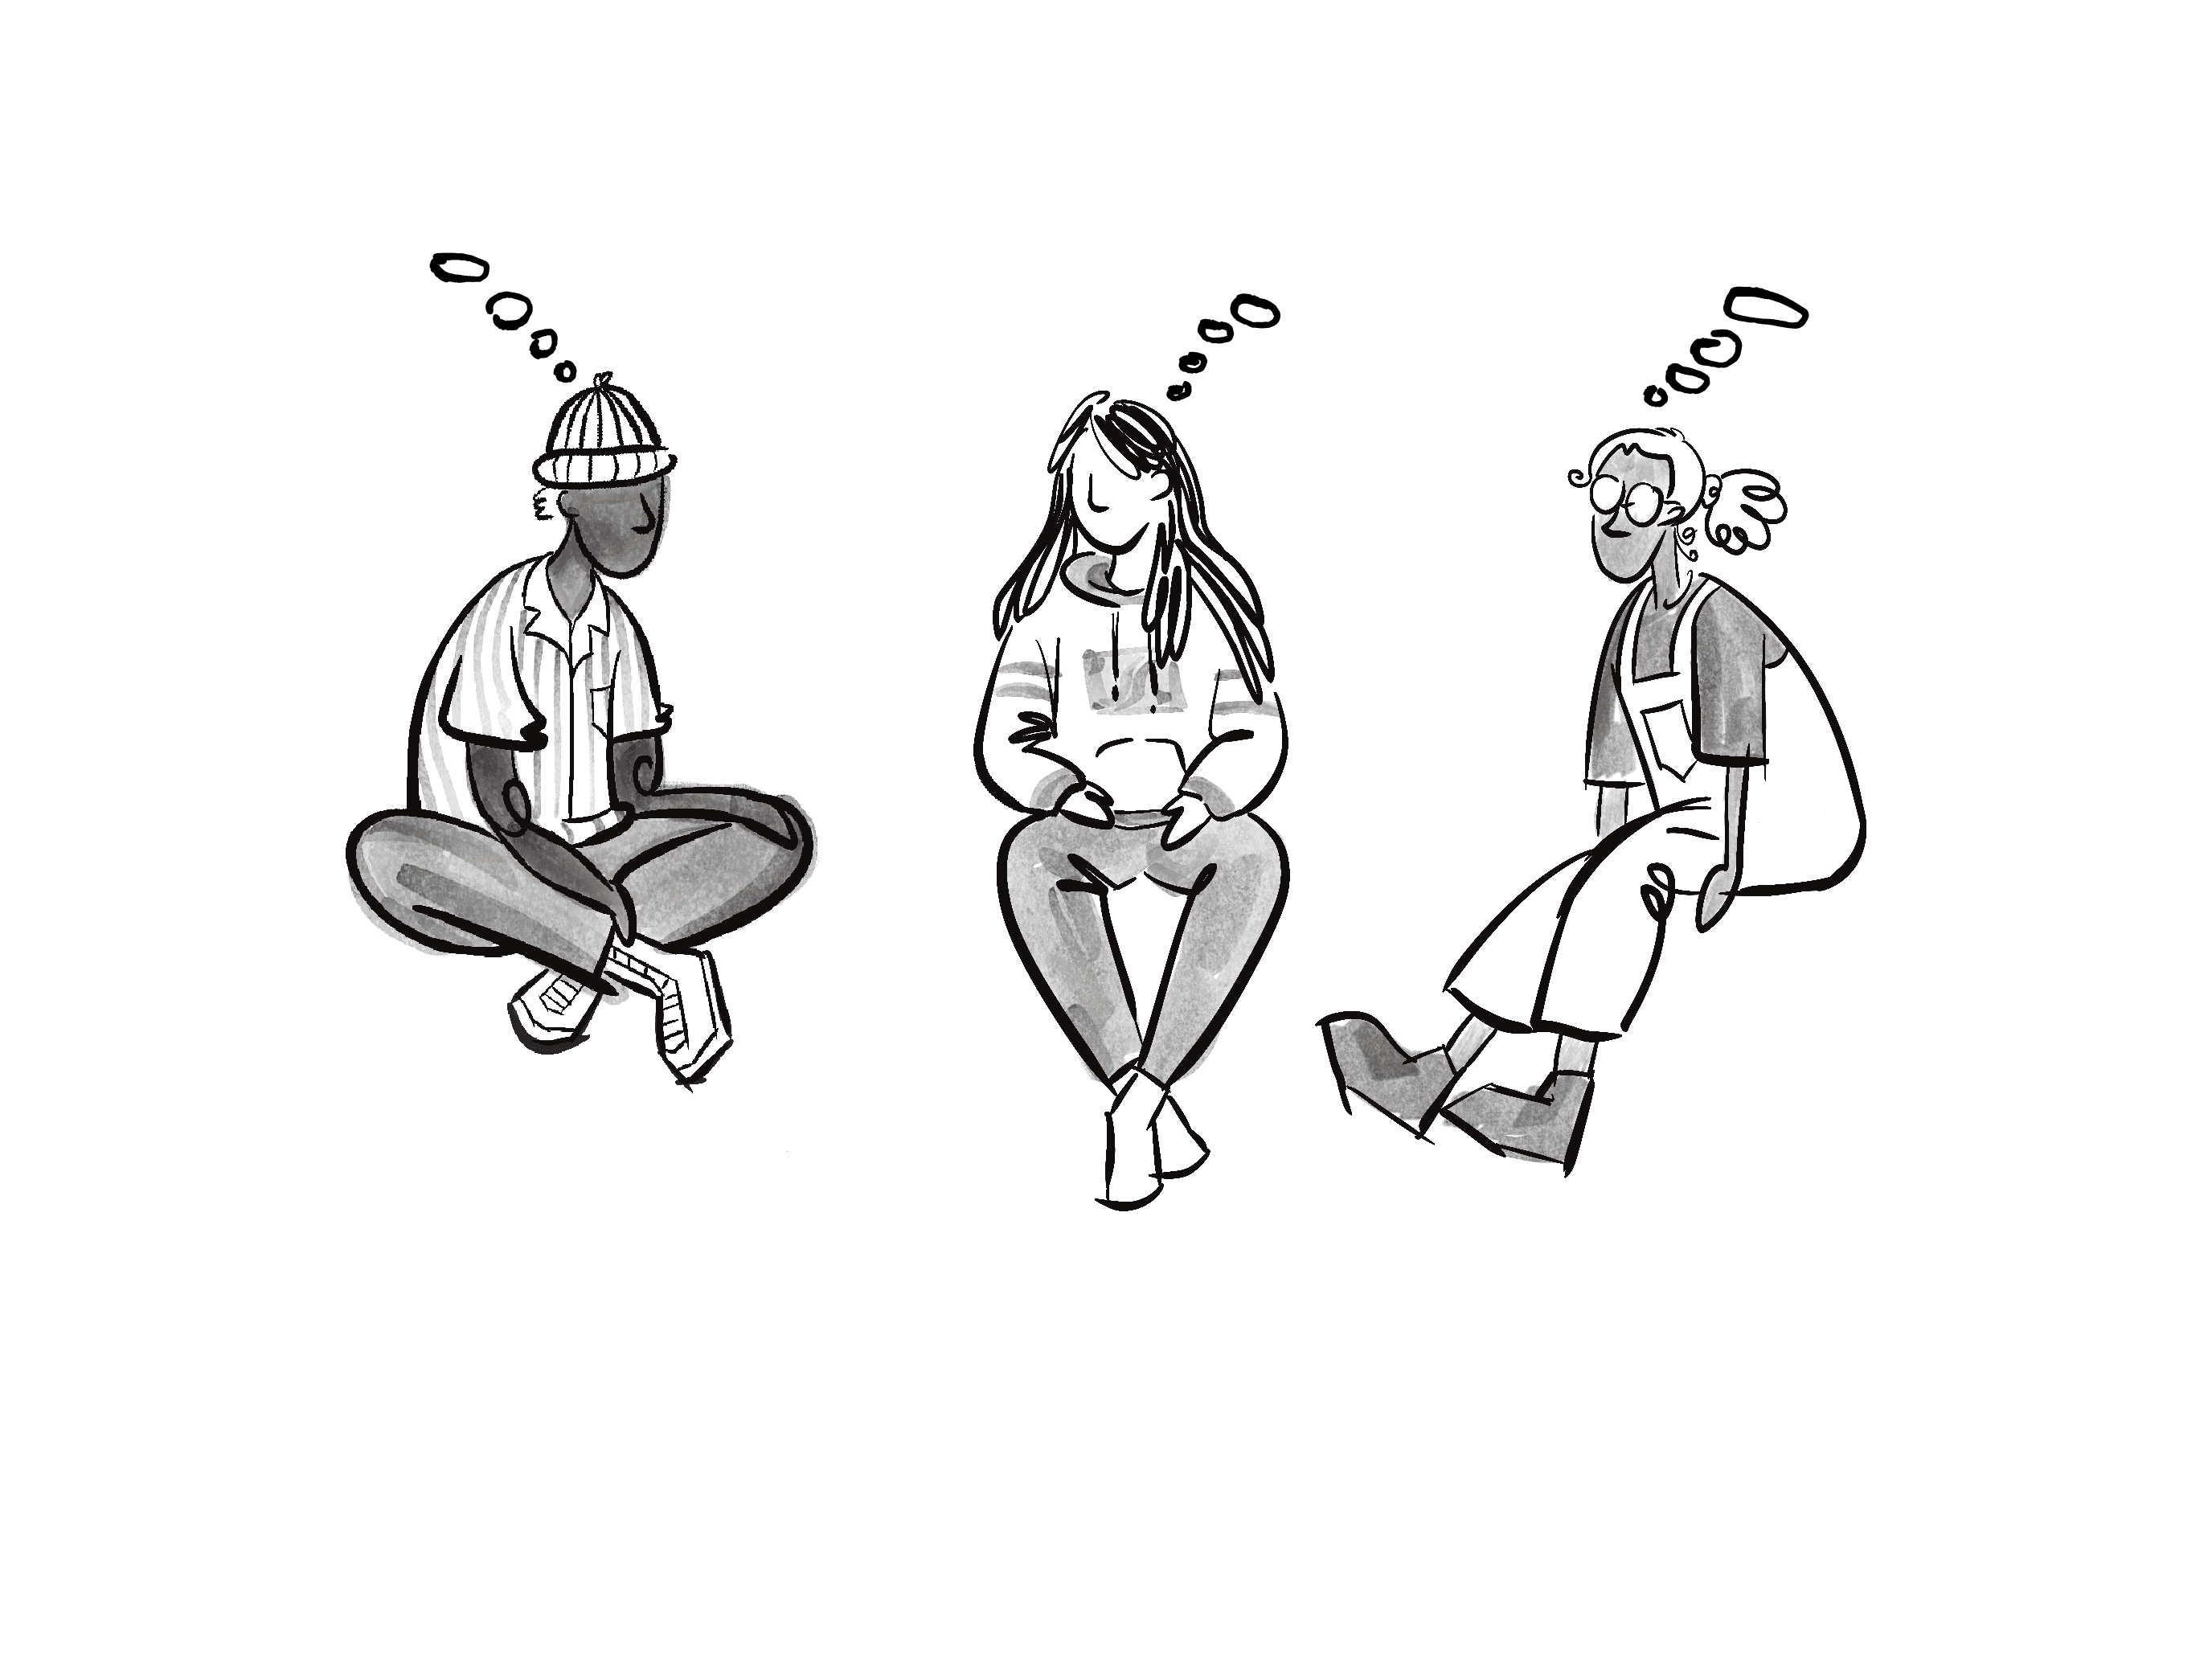
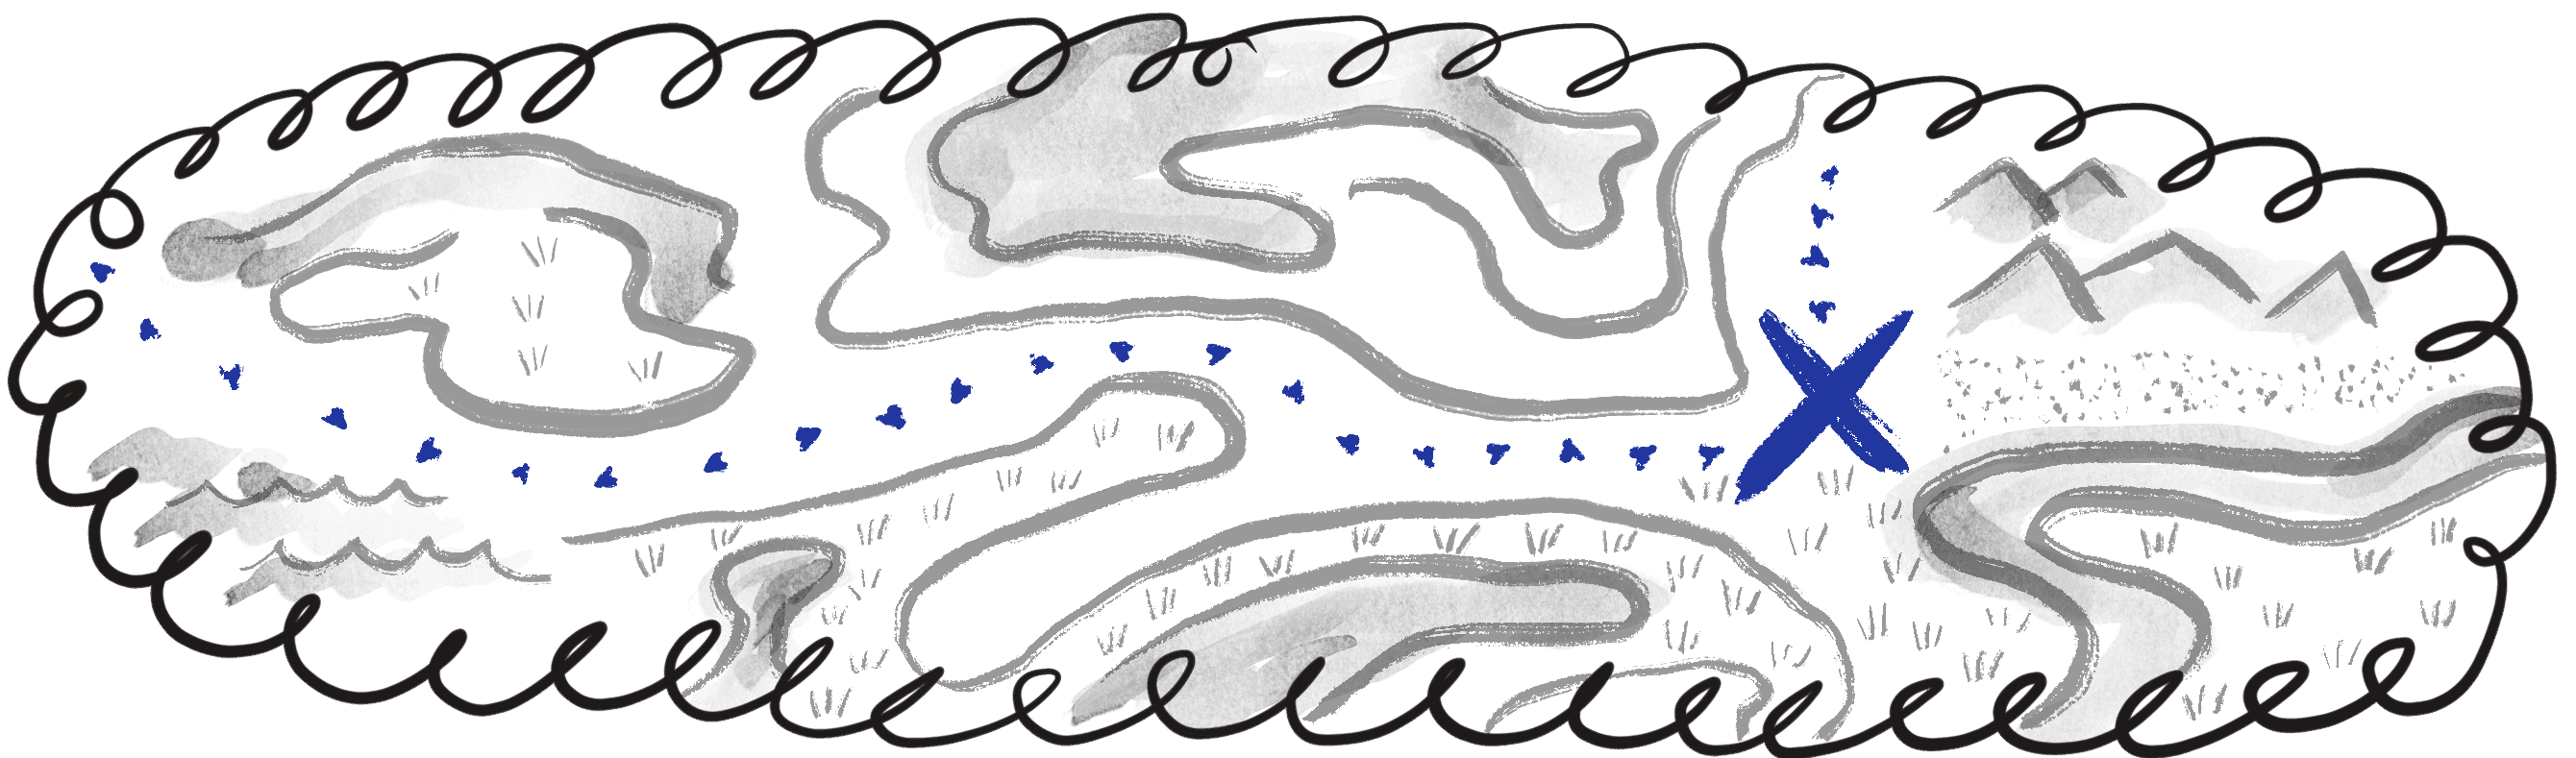



The journey from adolescence to the working world can be winding and uncertain. Young peoples’ backgrounds influence their paths in hidden and unexpected ways, from the obstacles they face to the resources they have to overcome them.
The visual updates to show a giant thought bubble above the teenagers’ heads depicting a winding and uncertain path.
There are lots of misconceptions out there about why increasing numbers of young people are NEET.
The visual updates to show individual thoughts like “unrealistic”, “flaky”, “lazy”, “lost”, and “depressed” floating above the teenagers’ heads.
When our plans don’t work out, and we’re not sure how to get back on track, we can feel lost. In that quiet limbo of neither working nor going to school, we start wondering if the person we thought we’d end up being was just a fantasy.
The visual updates to show only the third teenager, with a thought bubble that reads, “What if I’m just not good enough…”
Understanding which young people are at the highest risk of being NEET can unlock a conversation about the different barriers young people face, and the different support they might need to thrive.
The visual updates to show all three teenagers. Lists of various characteristics like qualifications, gender, ethnicity, location, and disabilities are above their heads indicating the positive or negative impacts on their NEET likelihood.
This knowledge helps policymakers understand what’s happening in their area, so they can provide targeted support to young people. This can result in well-evidenced programmes delivered by organisations like Spear and Generation UK.
The visual updates to show the three teenagers back on the couch watching TV. The TV shows a map of England and the current estimated NEET rate compared to 2019. England’s NEET rate rank is 11th highest of 32 OECD countries. Having a disability is the highest contributing factor, and those from disadvantaged backgrounds, who are white, have a disability, and low qualifications have a 40% likelihood of NEET.
Just as importantly, this research helps us tell our own stories and understand the stories of others. Seeing ourselves and each other reflected in the data builds a fuller, more honest picture of what young people are up against, and where change is needed most.
Data Exploration Dashboard
Last updated August 2026
Toggle to crosstab view to break down the data by different characteristics, and to download charts and data.
Percentage of 18-24 year olds not in employment, education or training